
Table of Contents
- The Problem with Measuring Content SEO
- Organic Traffic: The Most Misread Indicator
- Impressions and CTR: The Signal Hiding the Most Information
- Average Position: What Rises, What Falls, and What Actually Matters
- Semantic Authority: The SEO Content Metric Few Measure Correctly
- Time on Page and Engagement: Quality Metrics, Not Quantity
- Editorial Conversion: The Bridge Between Content and Business Results
- Indexing Speed and Content Freshness
- How to Build a Focused SEO Metrics Dashboard
- The Costliest Mistake: Optimizing for Metrics That Don’t Connect to Business
The Problem with Measuring Content SEO
When someone asks how their SEO content metrics are performing, the most common answer is: “Great — we’re climbing in the rankings.” But ranking for which keywords, at what pace, with what business impact? Nobody can answer that with actual data. And that gap is precisely where most editorial strategies fall apart.
The problem isn’t a lack of data. Google Search Console, GA4, Ahrefs, and Semrush generate hundreds of metrics. The real challenge is selection: which numbers actually matter for evaluating whether your content is doing its job, and which ones are noise dressed up as progress.
This article breaks down the metrics that carry real weight for assessing editorial content impact — distinguishing between technical health signals, semantic authority indicators, and editorial conversion measures — with concrete criteria for interpreting them honestly.
Organic Traffic: The Most Misread Indicator
Organic traffic is the first metric everyone looks at and the one most frequently misread. A 30% increase in organic visits can mean radically different things: you’ve gained authority in your niche, a viral article captured unqualified traffic, or Google changed how it displays your URLs in search results and your clicks improved without any action on your part.
How to Read Organic Traffic Without Fooling Yourself
The key is segmentation. Total traffic is an aggregate that blends TOFU awareness articles, MOFU consideration pages, and BOFU decision content. If you lump everything into a single number, you can’t know what’s working or why.
What works in practice is tagging your articles by funnel stage and grouping traffic by category. This way you can see whether your volume is primarily driven by informational terms that don’t convert, or whether consideration-stage content is gaining ground — which is typically where the greatest commercial value is generated.
A second useful segmentation: traffic by content cluster. If you have a group of articles covering the same topic, their collective performance matters more than any individual URL’s numbers. A cluster that totals 4,000 monthly visits across five articles is more solid — and harder to unseat — than a single article with 3,500 visits.
Impressions and CTR: The Signal Hiding the Most Information
Impressions in Google Search Console tell you how many times your URLs appeared in search results. CTR (click-through rate) tells you what percentage of those impressions turned into clicks. Together, these two SEO content metrics reveal something traffic alone cannot: whether you have visibility but aren’t getting people to actually click.
A low CTR with high impressions usually points to one of these problems: the title or meta description doesn’t match what the user is looking for, there’s a misalignment between the funnel stage and the type of snippet Google is displaying, or the article competes in a SERP dominated by featured snippets or paid results that push your position down.

Real Benchmarks by Result Type
According to research on search engine behavior, the average CTR for the first organic position ranges between 25% and 35% for searches without additional SERP elements. By position 5, it drops to 6–8%. For positions 6 through 10, CTR rarely exceeds 3–4%.
These numbers shift when the SERP includes a People Also Ask block, maps, video carousels, or ads. In those cases, even position 1 can see a CTR of just 15–20%. Understanding the SERP type your content is targeting is essential for interpreting CTR accurately.
Average Position: What Rises, What Falls, and What Actually Matters
Average position is useful as a trend indicator — not as an absolute number. An average position of 12 means nothing on its own. But if it was 18 three months ago and 14 last month, that upward trend is a real signal that your content is gaining topical authority.
The most common mistake is looking at the site’s overall average position. That blends URLs with completely different intents and hides more than it reveals. The useful approach is grouping URLs by topical cluster or funnel stage and tracking average position trends within each group.
When Average Position Can Mislead You
A rising average position can mask a serious problem: if your articles move from position 4 to position 6 on your most important keywords, but from position 40 to position 15 on lower-volume terms, the average improves even though real performance has declined. That’s why you always need to review the position distribution by keyword — not just the aggregate average.
Semantic Authority: The SEO Content Metric Few Measure Correctly
Semantic authority doesn’t appear as a number in any standard dashboard, but it can be inferred through a combination of signals. This is the indicator that best reflects whether your content strategy is building lasting search presence or simply accumulating disconnected articles.
The three most reliable proxies for measuring semantic authority on a content site are:
- Related keyword coverage: how many terms semantically close to your main keyword appear in Search Console with real impressions. If you publish an article on a topic and start receiving impressions for 15–20 related variations you didn’t explicitly optimize for, that’s a signal Google recognizes you as a relevant source in that territory.
- Internal cannibalization rate: if multiple URLs on your site compete for the same keyword, semantic authority becomes fragmented. Keeping this rate low — ideally under 10% of your URLs showing detected overlap — indicates a healthy editorial architecture.
- Number of keywords per URL: a semantically well-built article doesn’t just rank for its primary keyword; it generates impressions for 30–80 related terms. If your articles generate fewer than 15–20 keywords with impressions, they’re typically too narrow or too short to establish topical authority.
Time on Page and Engagement: Quality Metrics, Not Quantity
With the migration from Google Analytics to GA4, the “time on page” metric changed how it’s calculated. GA4 no longer measures the time between pageviews; instead, it tracks “active engagement time” — when the tab is in the foreground and the user is interacting. This makes GA4 figures systematically lower than Universal Analytics numbers, but also more accurate.
For editorial SEO content, the average engagement time that indicates an article is actually being read — not just opened — falls between 2:30 and 4:30 minutes for articles in the 1,500–2,500 word range. If your articles show engagement times below 1:30, either the visual structure isn’t inviting readers to continue, or the content isn’t delivering what users expected to find.
Scroll Depth as a Complement
Scroll depth — what percentage of the article a user reads before leaving — is a content metric GA4 lets you track through custom events or tools like Microsoft Clarity. A well-structured article typically shows 60–75% scroll depth among active readers. If it drops below 40%, the problem usually lies in the first three paragraphs or in the subheading structure.
Editorial Conversion: The Bridge Between Content and Business Results
Editorial conversion is the hardest metric to measure and the most important for justifying investment in SEO content. It’s not just about direct sales from an article — that rarely happens with TOFU or MOFU content — but about tracking how content contributes to the full user journey.
The most useful editorial conversion touchpoints to measure are:
- Clicks to conversion pages from content: how many of your article readers navigate to product, service, or contact pages. This is set up as an event in GA4 and lets you see which articles have the highest referral rate to conversion pages.
- Conversion assists: GA4 and attribution tools like Northbeam or Triple Whale let you see how many conversion paths include organic content, even when it isn’t the last click. An article that appears in 30% of conversion paths has very real value — even if it generates no direct conversions.
- Return rate of organic users: users who first arrived via organic search and then came back directly or via branded search. This indicator reflects that the content built enough trust for users to remember the site.
Indexing Speed and Content Freshness
One metric editorial teams often overlook is the time between publication and indexing. On sites with clean architecture and a healthy crawl budget, a new article should appear indexed in Google within 48–72 hours. If your articles take more than a week to get indexed, there’s a structural issue — an outdated sitemap, canonical problems, or a weak internal link architecture — that’s holding back the performance of all your new content.
Freshness also matters for evergreen articles. Google values content updates when they’re substantive — minor date changes alone don’t cut it. Articles that haven’t been meaningfully updated in 18–24 months tend to lose positions in sectors where information evolves. Tracking the real last-modified date and the position trends of older articles is part of a mature SEO metrics strategy.
How to Build a Focused SEO Metrics Dashboard
The goal of a solid SEO content metrics system isn’t to have more data — it’s to have less data with more context. A practical dashboard for an editorial team typically has 8 to 12 metrics, not 50.
A structure that works well in practice:
- Technical health: indexed pages vs. published pages, indexing rate, crawl errors in Search Console.
- Organic visibility: total impressions by topical cluster, CTR by funnel stage, average position trends for primary keywords.
- Read quality: average engagement time by article group, scroll depth on long-form articles.
- Editorial impact: conversion assists from organic content, return rate of organic users, internal clicks to conversion pages.
This kind of structure lets you quickly identify whether a problem is technical (indexing), visibility-related (position/CTR), quality-related (engagement), or impact-related (conversion). That distinction dramatically speeds up your decision-making.
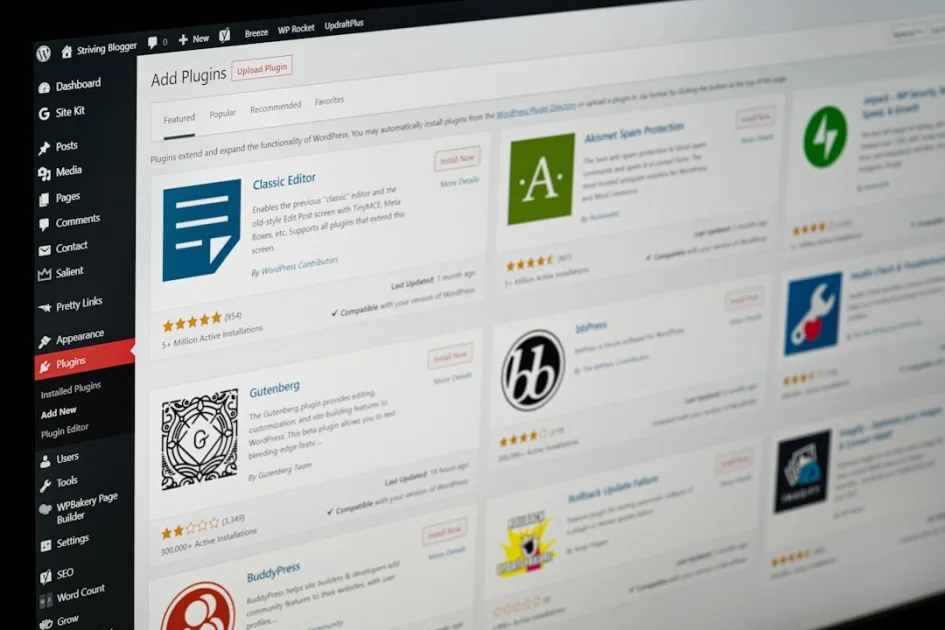
If you work with a content automation system integrated into WordPress, some of these metrics can be tracked directly within the editorial platform. Tools available within the WordPress plugin ecosystem allow you to connect publishing with results tracking without juggling five separate tools. If you’d like to see how this works in practice, you can review the Klusto plans to understand what level of automation makes sense for your editorial volume.
The Costliest Mistake: Optimizing for Metrics That Don’t Connect to Business
The real risk for editorial teams isn’t measuring too little. It’s measuring well but measuring the wrong things. A team that optimizes for “number of articles published” produces volume. A team that optimizes for “global average position” might be improving on keywords that don’t matter to the business. A team that only watches traffic might be celebrating visits that will never convert.
The SEO content metrics that truly matter are those that connect editorial activity to measurable outcomes: visibility in high-intent keywords, real engagement that signals comprehension, and trackable contribution to the conversion pipeline. Everything else is useful context — not strategic direction.
Building that measurement system takes time — especially on sites with legacy editorial architecture or inconsistent tagging — but it’s the difference between a team that produces content and a team that builds a lasting SEO asset.
Team’s Take
When I review a site’s content strategy, the first thing I look at isn’t total traffic — it’s how that traffic is distributed by funnel stage and topical cluster. I’ve seen projects with 80,000 monthly visits generating fewer qualified leads than others with 12,000, simply because the former had accumulated TOFU articles with no editorial connection between them and no SEO content metrics in place to surface that misalignment. Measuring well doesn’t mean measuring more — it means choosing the indicators that tell you whether your content is fulfilling its real function within the strategy, not just whether it shows up in Google.

Written by
Klusto Team
Klusto is the WordPress plugin that automates your SEO blog with AI: plans BOFU/MOFU/TOFU clusters, prevents 3-layer cannibalization, and publishes optimized articles without leaving wp-admin. No external SaaS. No migration.